Introduction
IDA Pro 5.6 has a new feature: automatic running of the QEMU emulator. It can be used to debug small code snippets directly from the database.
In this tutorial we will show how to dynamically run code that can be difficult to analyze statically.
Target
As an example we will use shellcode from the article "Alphanumeric RISC ARM Shellcode" in Phrack 66.
It is self-modifying and because of alphanumeric limitation can be quite hard to undestand. So we will use the debugging feature to decode it.
The sample code is at the bottom of the article but here it is repeated:
80AR80AR80AR80AR80AR80AR80AR80AR80AR80AR80AR80AR80AR80AR80AR80AR80AR80AR 80AR80AR80AR80AR80AR80AR80AR80AR80AR00OB00OR00SU00SE9PSB9PSR0pMB80SBcACP daDPqAGYyPDReaOPeaFPeaFPeaFPeaFPeaFPeaFPd0FU803R9pCRPP7R0P5BcPFE6PCBePFE BP3BlP5RYPFUVP3RAP5RWPFUXpFUx0GRcaFPaP7RAP5BIPFE8p4B0PMRGA5X9pWRAAAO8P4B gaOP000QxFd0i8QCa129ATQC61BTQC0119OBQCA169OCQCa02800271execme22727
Copy this text to a new text file, remove all line breaks (i.e. make it a single long line) and save. Then load it into IDA.
Loading binary files into IDA
IDA displays the following dialog when it doesn't recognize the file format (as in this case):
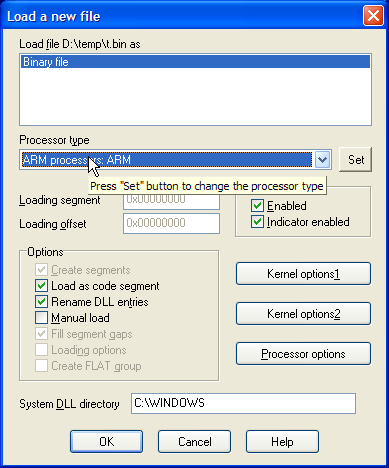
Since we know that the code is for ARM processor, choose ARM in the "Processor type" dropdown and click Set. Then click OK. The following dialog appears:
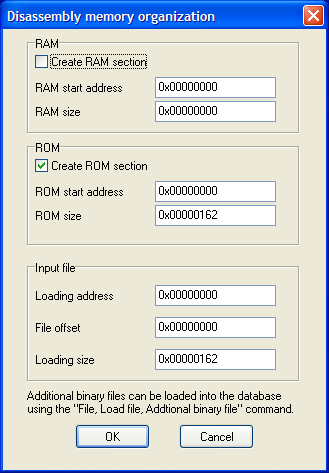
When you analyze a real firmware dumped from address 0, these settings are good.
However, since our shellcode is not address-dependent, we can choose any address. For example, enter 0×10000 in "ROM start address" and "Loading address" fields.
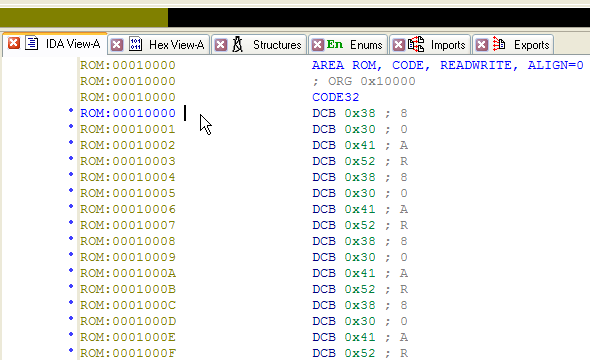
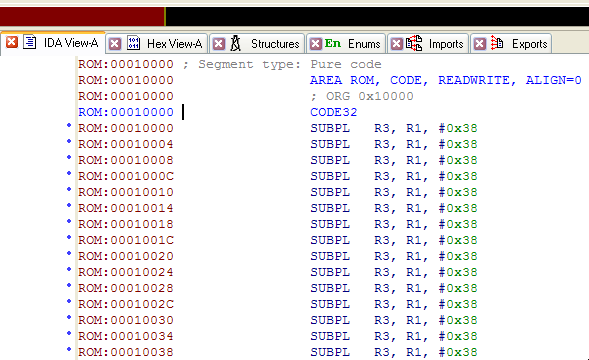
IDA doesn't know anything about this file so it didn't create any code. Press C to start disassembly.
Configuring QEMU
Before starting debug session, we need to set up automatic running of QEMU.
- Download a recent version of QEMU with ARM support (e.g. from http://homepage3.nifty.com/takeda-toshiya/qemu/index.html).
If qemu-system-arm.exe is in a subdirectory, move it next to qemu.exe and all DLLs.
Note: if you're running Windows 7 or Vista, it's recommended to use QEMU 0.11 or 0.10.50 ("Snapshot" on Takeda Toshiya's page),
as the older versions listen for GDB connections only over IPv6 and IDA can't connect to it. - Edit cfg/gdb_arch.cfg and change "set QEMUPATH" line to point to the directory where you unpacked QEMU. Change "set QEMUFLAGS" if you're using an older version.
- In IDA, go to Debug-Debugger options…, Set specific options.
- Enable "Run a program before starting debugging".
- Click "Choose a configuration". Choose Versatile or Integrator board. The command line and Initial SP fields will be filled in.
- Memory map will be filled from the config file too. You can edit it by clicking the "Memory map" button, or from the Debugger-Manual memory regions menu item.
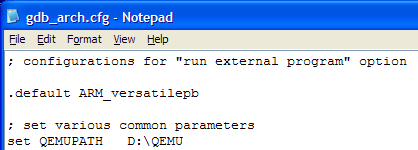
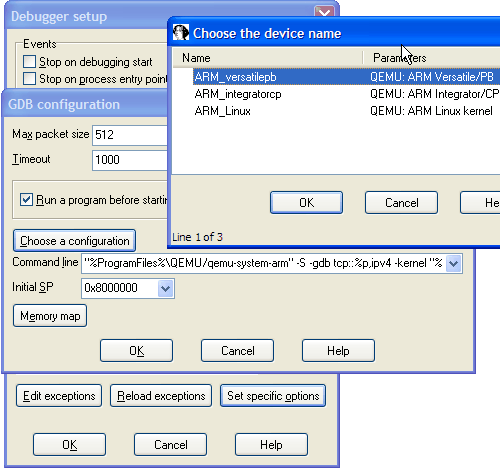
Now on every start of debugging session QEMU will be started automatically.
Executing the code
By default, initial execution point is the entry point of the database. If you want to execute some other part of it, there are two ways:
- Select the code range that you want to execute, or
- Rename starting point ENTRY and ending point EXIT (convention similar to Bochs debugger)
In our case we do want to start at the entry point so we don't need to do anything. If you press F9 now, IDA will write the database contents to an ELF file (database.elfimg) and start QEMU, passing the ELF file name as the "kernel" parameter.
QEMU will load it, and stop at the initial point.
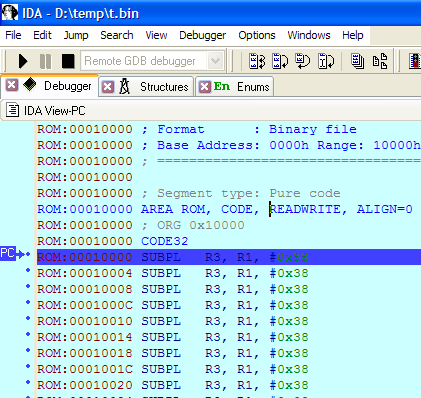
Now you can step through the code and inspect what it does. Most of the instructions "just work", however, there is a syscall at 0×0010118:
ROM:00010118 SVCMI 0×414141
Since the QEMU configuration we use is "bare metal", without any operating system, this syscall won't be handled. So we need to skip it.
- Navigate to 010118 and press F4 (Run to cursor). Notice that the code was changed (patched by preceding instructions):
- Right-click next line (0001011C) and choose Set IP.
- Press F7 three times. Once you're on BXPL R6 line, IDA will detect the mode switch and add a change point to Thumb code:
- Go to 01012C and press U (Undefine).
- Press Alt-G (Change Segment Register Value) and set value of T to 1. The erroneous CODE32 will disappear.
- Go back to 00010128 and press C (Make code). Nice Thumb code will appear:
- In Thumb code, there is another syscall at 00010152. If you trace or run until it, you can see that R7 becomes 0xB (sys_execve) and R0 points to 00010156.

(Incidentally, 0x9F0002 is sys_cacheflush for ARM Linux.)

However, the following, previously existing code will (incorrectly) stay in ARM mode. We need to fix that.
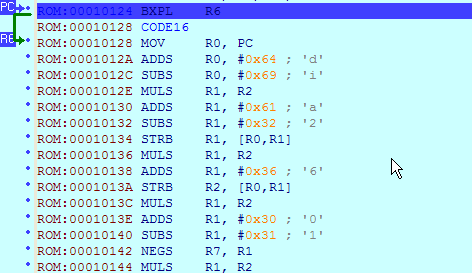
If you undefine code at 00010156 and make it a string ('A' key), it will look like following:
Thus we can conclude that the shellcode tries to execute a file at the path "/execme".
Hint: if the code you're investigating has many syscalls and you don't want to handle them one by one, put a breakpoint at the address 0000000C (ARM's vector for syscalls). Return address will be in LR.
Saving results to database
If you want to keep the modified code or data for later analysis, you'll need to copy it to the database. For that:
- Edit segment attributes (Alt-S) and make sure that segments with the data you need have the "Loader segment" attribute set.
- Choose Debugger-Take memory snapshot and answer "Loader segments".
- Now you can stop the debugging and inspect the new data.
Note: this will update your database with the new data and discard the old. Repeated execution probably will not be correct.
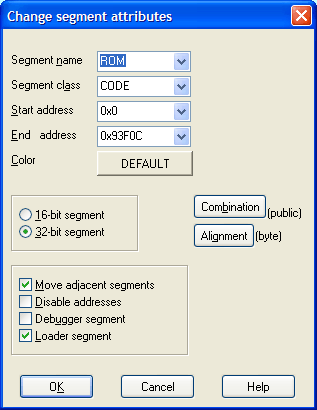
Note: if you answer "All segments", IDA will try to read the whole RAM segment (usually 128M) which can take a VERY long time.
This concludes our short tutorial. You can get an offline PDF version with a slightly more complex example and
more background info here.
0 件のコメント:
コメントを投稿